Flood Forecasting for Rum River
In response to a request from eight local government units, the National Weather Service (NWS) will begin flood forecasting for lower segments of the Rum River. Until now, there is no flood forecasting for the Rum River. River level forecasting will begin in 2020 whenever the river is approaching critical elevations. Forecasts are provided as a graph of past, current and forecasted future water levels relative to critical elevations for homes and infrastructure.
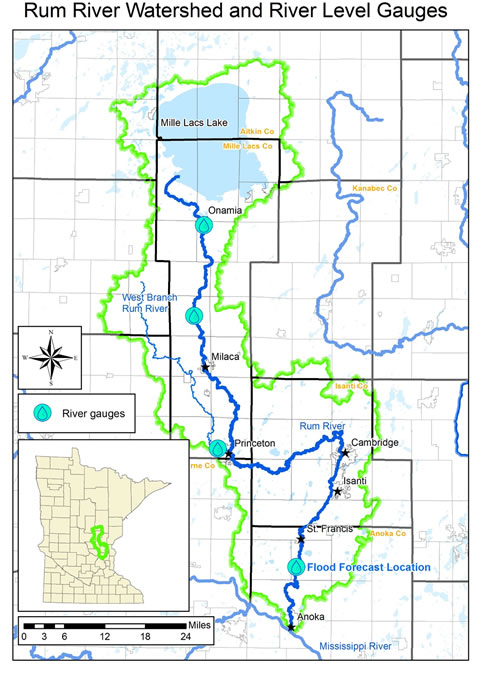
The Rum River originates from Lake Mille Lacs and discharges to the Mississippi River in Anoka. Between those points it flows through rural lands, farm country and suburbia. Cities situated on its banks include Milaca, Princeton, Cambridge, Isanti, St. Francis and Anoka.
The forecasts will be directly applicable to the Rum River within Anoka County while providing general guidance to other communities upstream. Forecasting relies upon automated stations that track river water levels and volumes continuously. The station in Anoka County has 86 years of that water data and there are upstream monitoring stations help calculate flood forecasts at that location. Three river monitoring stations in Isanti and Mille Lacs Counties measure water level only, not volume, and cannot be forecasted yet.
“Getting flood forecasting is important to many communities throughout the watershed,” states Jamie Schurbon, Watershed Projects Coordinator at the Anoka Conservation District. The request that prompted the National Weather Service to begin Rum River flood forecasting was supported by emergency managers in Anoka, Isanti, and Mille Lacs counties, those counties’ soil and water conservation districts, and cities.
Large scale flooding has not been a regular problem along the Rum River, however there are areas of concern. “There are homes or roads that can be flooded in extreme events,” stated Schurbon. “Higher water has been occurring more frequently, which increases the odds of a damaging flood.”
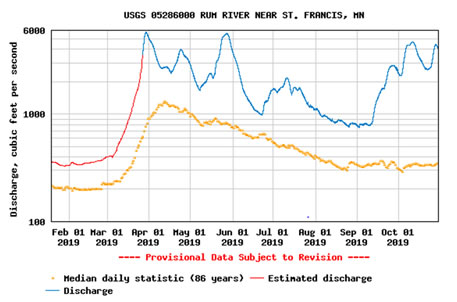
2019 is one such year when high water has been sustained. According to date from the US Geological Survey, which operates the river level gauge at Viking Boulevard, over the last 86 years the median daily river flow only exceeds 1,000 cubic feet per second (cfs) for a month in the spring. By comparison, in 2019 the river flows were above that level for six of eight open water months. It has exceeded 4,000 cfs four times. The river has overflowed into floodplains each of those occasions.
The NWS will issue flood forecasts whenever the river level exceeds an “action” level of 7 feet at Viking Boulevard. Flood stages are 8 feet (minor), 10 feet (moderate) and 11 feet (major). If these numbers are applied to 2019, flood forecasts would have been issued in March, April, May, June and October. Flood stage was reached or nearly reached in March and May. “When the river is that high, one additional big rainfall or snowmelt could push it into a damaging flood stage,” commented Tiffany Determan, Manager at the Isanti Soil and Water Conservation District. “We’ve seen that happen in other areas around the state in recent years.”
Local governments provided the NWS with data to inform critical flood elevations, such as the “action” level. These data include elevations of roads and homes that might flood. “Local knowledge, combined with a strong NWS model and 86 years of river level data, should make for a very reasonable forecasting tool” according to Craig Schmidt, Hydrologist at the NWS.
Flood forecasting will give local governments and homeowners better information and potentially valuable time to prepare when waters are approaching critical elevations. Moving items out of low areas, routing traffic around flooding roads, or sandbagging are common, but not the only, preparations. The Rum River dam in Anoka has a sluice gate and seasonally-installed flashboards that can be moved to help prevent or alleviate upstream flooding.
Water level graphs for the Rum River, and many of others across the country, are available on the National Weather Service website at https://water.weather.gov/ahps. The Rum River flood forecasts will be available on this same website starting in February 2020.
The costs of flood forecasting are paid by the National Weather Service.
Rum River discharge in 2019 compared to median discharge of the last 86 years.
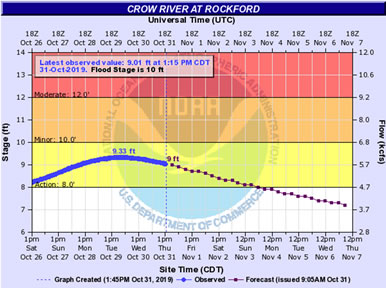
Example flood forecast from the Crow River.